
For Exploration Kit ONLY (Note: the Exploration kit and the ReLax kit are not compatible with each other, due to differences in sample rate and RF settings.)
You can download the OPIconsole program here.
After downloading the OPIconsole program, please read this brief manual and get familiar with how to use the OPIconsole to operate your TrueSense Exploration Kit.
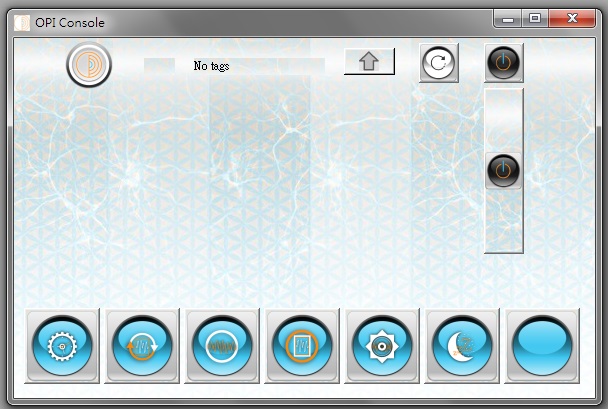
1. Uncompress the programs, select and execute OPIconsole under your operating system. The main interface will look like this: showing the presence of Controller (with no tags yet), and with no Sensor and MM attached yet.
2. Now you can plug in the Sensor into the MM, then into the Controller in 3-in-1 configuration as in Get Started with TrueSense Kit: a brief Manual. The screen images below show the function of each of the buttons on the OPI Console. You can click these buttons and get familiar with their effects.
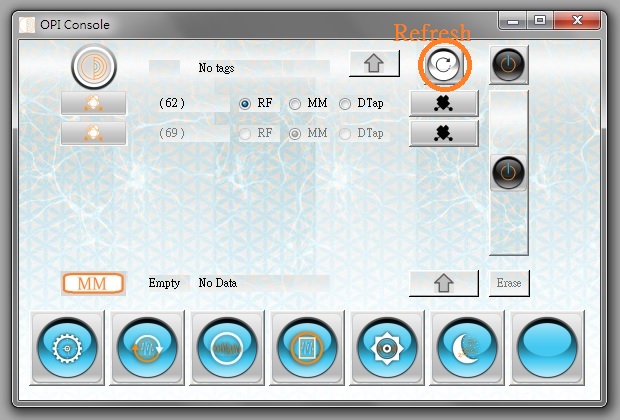
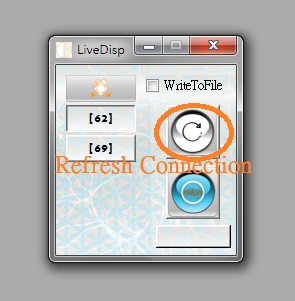
Click "Refresh" to update or confirm the status of the Controller, the Sensor and the MM. Any synchronization inconsistency between Controller and Sensor will show up in red (as warning flag), simply click and unclick the button highlighted in red, and click "Refresh" again to clear the inconsistency. You should click "Refresh" often to ensure the main interface display is consistent with actual Controller and Sensor status.
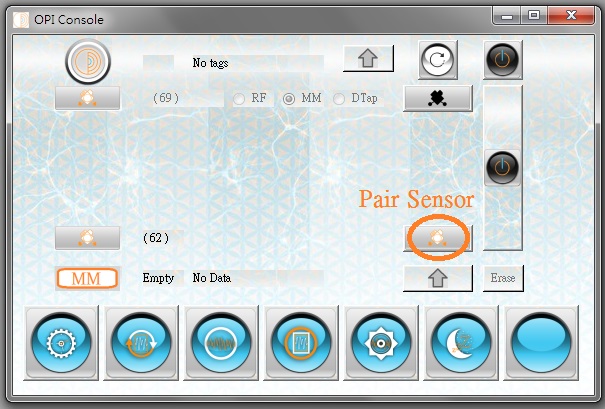
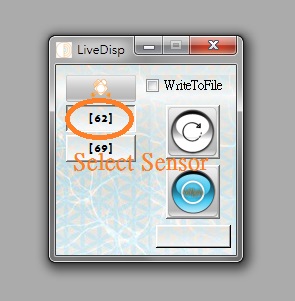
If this is the first time you connect the Sensor and the Controller together, the Sensor will be shown in the lower section ((62) in this example), and you will need to click "Pair Sensor" to let them know each other and establish synchronization and communication privileges (such as RF link) from the Sensor.
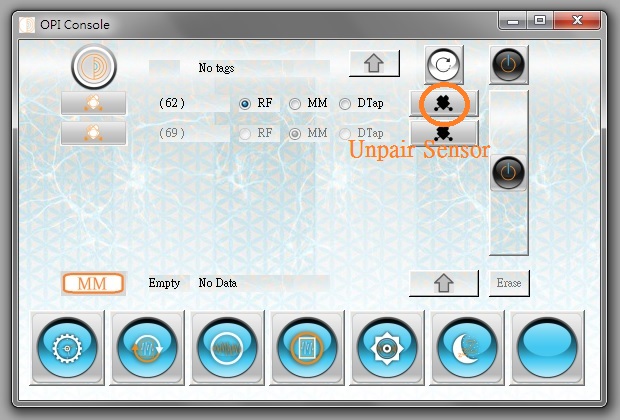
You can also click "Unpair Sensor" to disable communication privileges (such as RF link) from the Sensor.
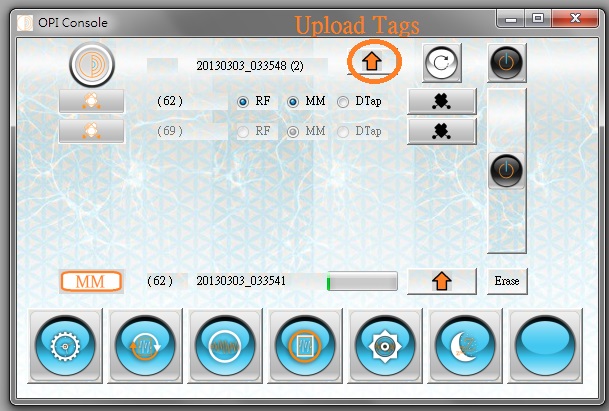
Now press the "+" or "-" buttons on the Controller, and click "Refresh", and you can see the Tags showing up. Click "Upload Tags", the tags will be uploaded to a text file that can be incorporated into EDF+ file later, or be edited using any text editor.
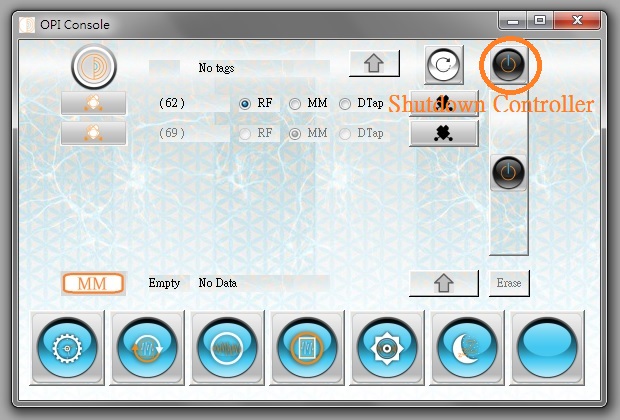
Be very careful with this "Shutdown Controller" button, it will completely power down (for storage, etc.) the Controller and disconnect from this or any program. To power up the Controller, please remove the Controller from the USB port, and connect it back again, wait a few seconds, and then click "Refresh" and it will be back ON again.
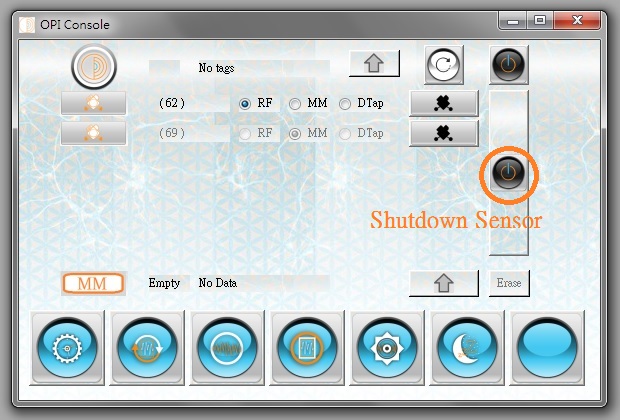
Click "Shutdown Sensor" will power down the connected Sensor (highlighted (62) in this example). Click again, the Sensor will power up again. Click "Refresh" to confirm the status of the Sensor.
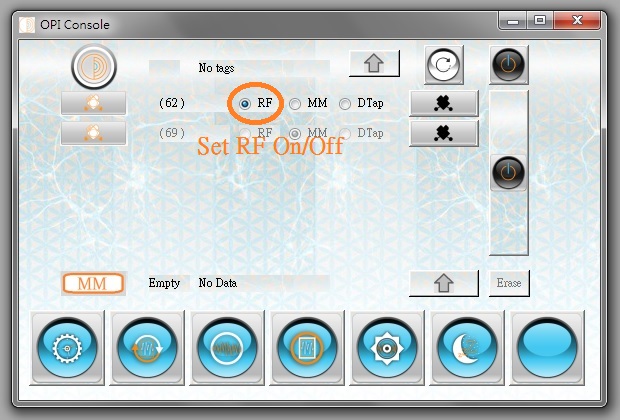
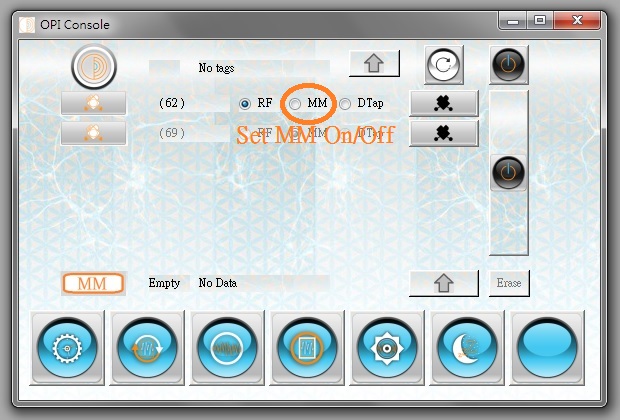
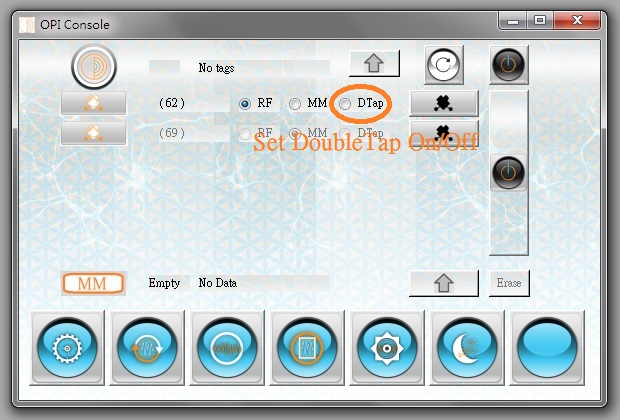
To set the Sensor configuration, use the "Set RF On/Off", "Set MM On/Off" and "Set DoubleTap On/Off" toggle buttons.
Toggle "Set RF On/Off" button to control RF: ON for Live Display or BioFeedback sessions, or if you want to ensure the Sensor is operating properly during MM recording session. OFF for MM recording or keeping the Sensor in standby. Note: the default RF power (you can change it in debug App) for TrueSense Sensor is set at a low -4.5dBm level to minimize (unknown) harmful RF effects. It is a good defensive practice to keep RF ON time to a minimum.
Toggle "Set MM On/Off" button to control MM recording: ON (and if MM is plugged in Sensor) for high quality recording in MM, and OFF for not recording (even if MM is plugged in Sensor.) After recording session, you will need to plug MM into Controller to upload the recorded data.
Toggle "Set DoubleTap On/Off" to control DT: This is a cool (StarTrek-like) feature to play with, but not recommended for serious recording sessions. While RF is OFF, and DT is ON, the user has the ability to turn RF ON and OFF with the correct execution of double-tapping on the Sensor. You should run practice/training sessions using Live Display App, so you can learn to master this special control mode.
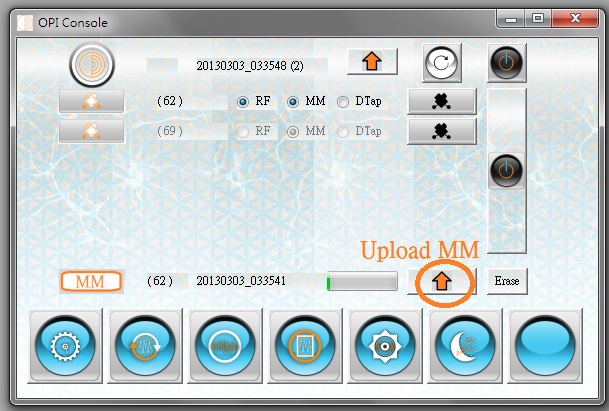
Click "Upload MM" to upload recorded sessions from MM. The upload time depends on the length of recorded time and your computer's CPU loading and USB port activity level, and is usually 10~15 minutes for a full 11+hours recording session. While the uploading is in progress, you can use ViewConvert App to view partial results without waiting for its completion.
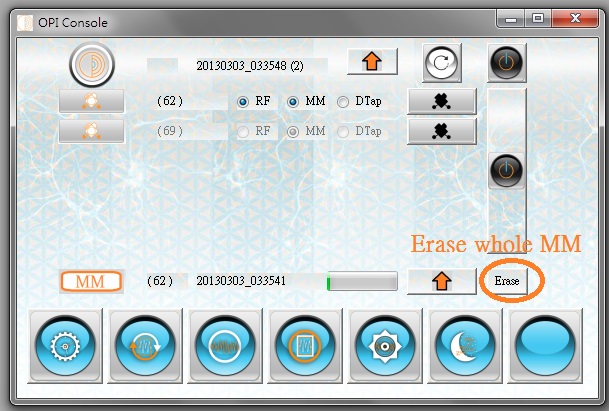
After successful completion of Upload MM, you can erase and reinitialize the whole MM by clicking "Erase whole MM". This will take approximately 150sec or less, independent of length of recorded time.
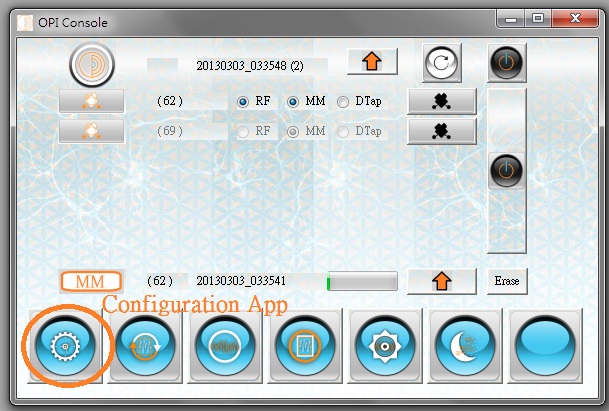
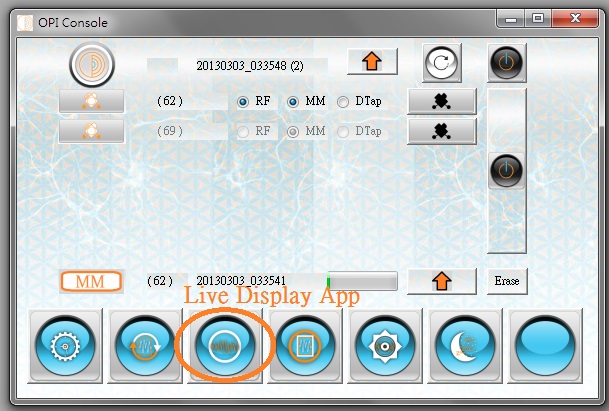
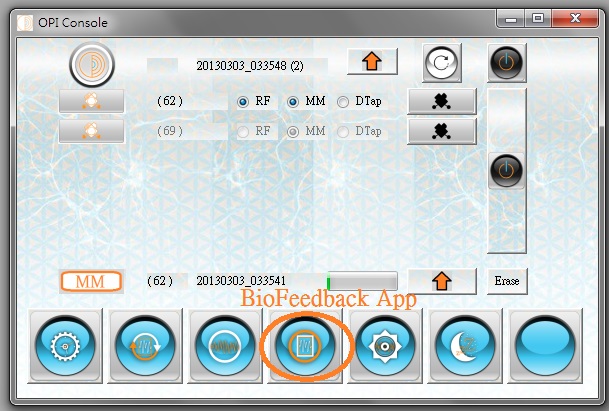
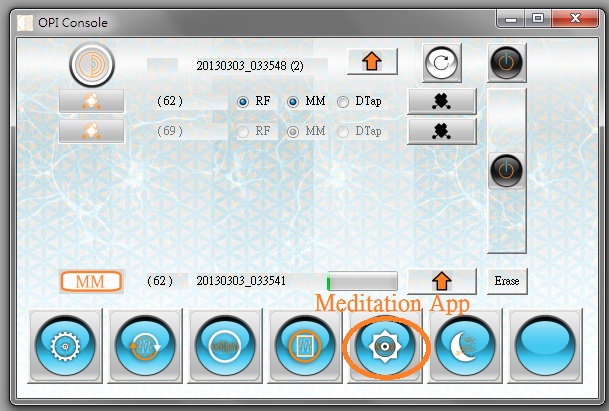
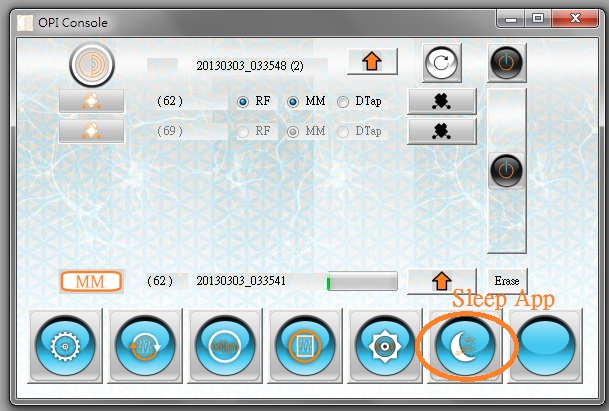
To launch the Configuration App, ViewConvert App, LiveDisplay App, BioFeedback App, Meditation App and Sleep App, please click the corresponding button as shown below.
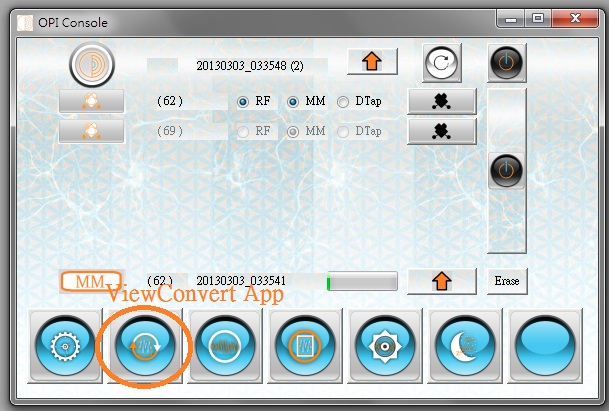
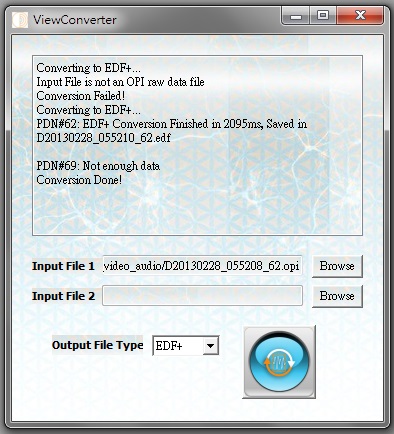
3. Now click on the ViewConvert App, and a new interface will come up.
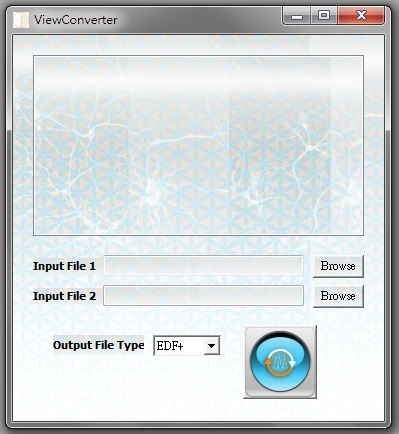
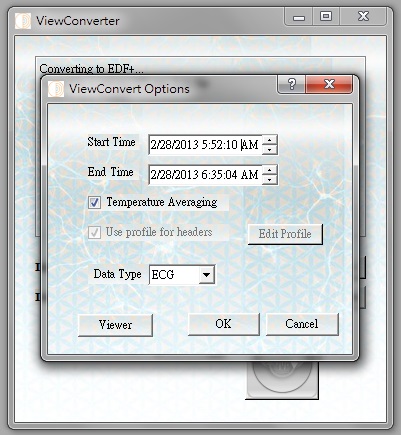
After choosing an input file, and output File Type (EDF+ or WAV), and click on "ViewConvert", the Options interface will show up, which you can specify Data Type (Generic, EEG, ECG, etc.), Start Time and End Time (for selecting time segment of interest for further processing), and start conversion. Alternatively, you can go to Viewer to view recorded data, or visually select time segment of interest and edit Tag entries for conversion.
After the conversion or viewing is completed, it will return to ViewConvert interface, with summary added.
4. Now click the LiveDisplay App, and a new interface will come up.
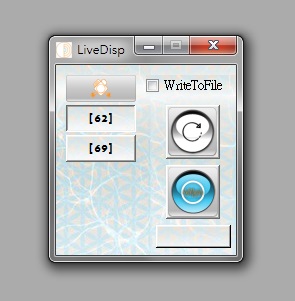
The respective functions are shown below.
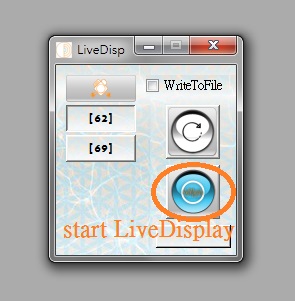
After click on "Start LiveDisplay", the main display interface will show up.
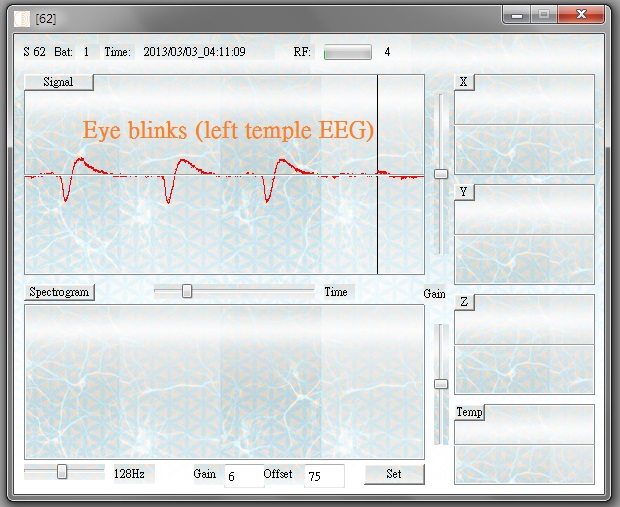
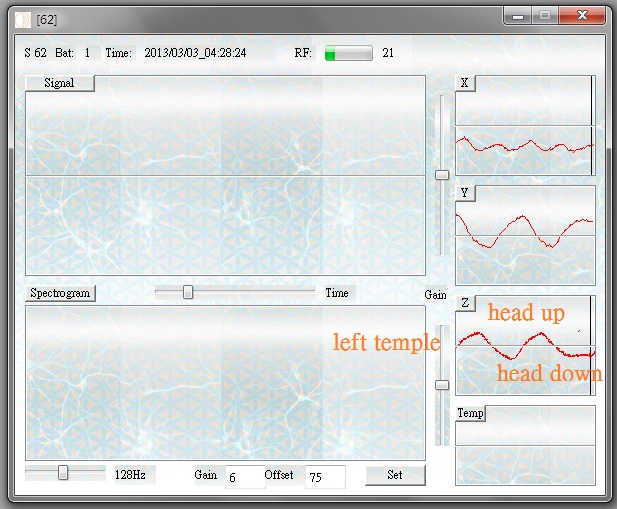
Click on "Signal Pane" and the EEG waveform will start to show. You can control the signal gain by moving the Gain Slider to the right of the pane, and control the time scale by moving the Time Slider below the pane. This example shows 3 eye blinks (EOG) and their nice smooth waveform (containing mostly low frequency spectrum) with the Sensor mounted close to the eye (around left temple).
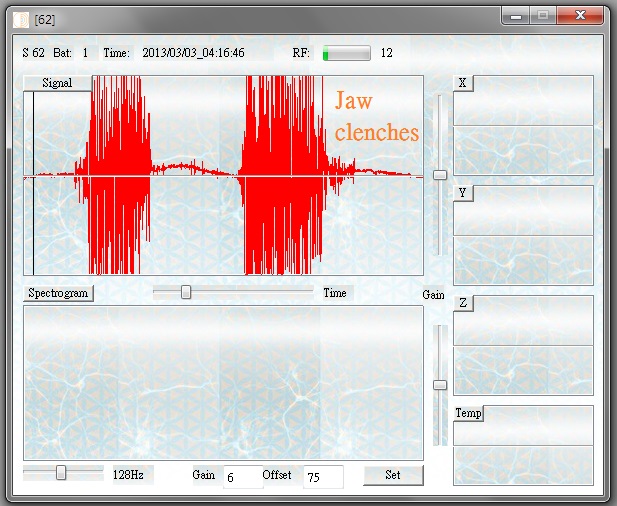
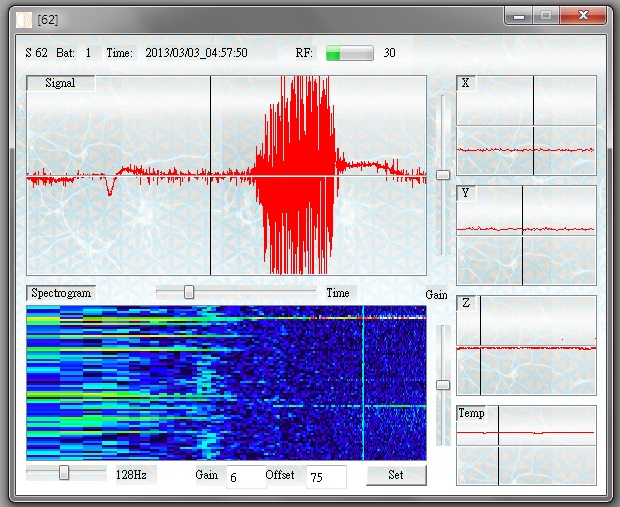
Now, try clenching your jaw tightly. That is, close your mouth and teeth/jaw and do a chewing action without moving your mouth and teeth/jaw. You can see a huge muscle signal (EMG). Two EMG clusters are shown here. Jaw clenching is a very useful "marker" or "tag" that can be inserted before or after an event, silently and without being noticed by others, because jaw clenching can be easily seen visually in both waveform and spectrogram displays. Controlled multiple jaw clenching can also be easily differentiated from other more natural muscle activities such as eating and tensing up.
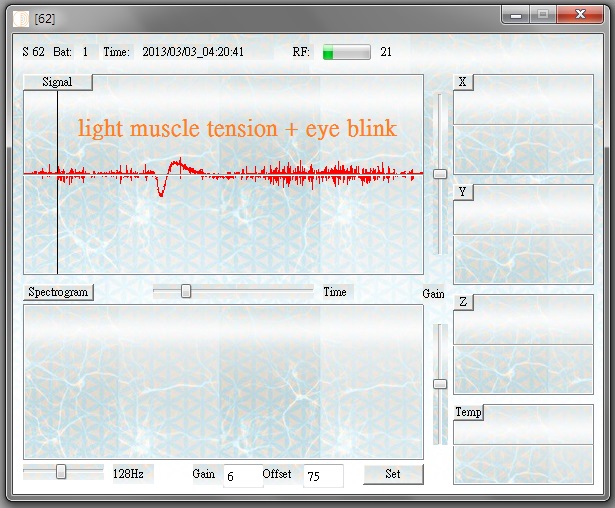
Now a simple combination of eye blink plus light jaw clenching (or any other facial muscle tensing up,) the EMG signals are still much bigger than true EEG signal.
Click off "Signal Pane" and click on "X", "Y", "Z" Panes. Now move your head slowing forward (down) and back (up), you can see Z-pane tracks your head movement very well, with "Down" and "Up" clearly marked. Try moving your head sideways slowly and compare the results. You can "calibrate" your head's upright position this way, using simple routine (not shown here) combining XYZ data. Of course, the posture data will be more easily readable if the Sensor is attached to the center of forehead, rather than on one side in this example.
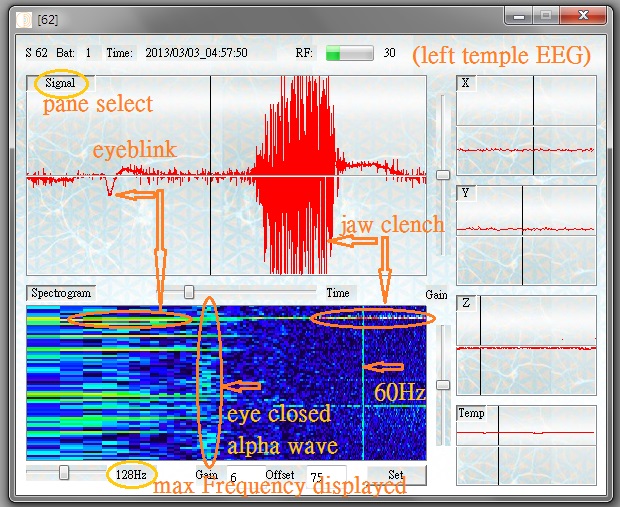
The following example shows features with all panes clicked ON. Signal pane shows light muscle tension followed by eye blink followed by jaw clenching. The head posture is relatively steady. The spectrogram data is actually accumulated over 3 minutes, showing 3 periods when eyes are closed and alpha wave are clearly seen.
The same example, now added with annotations to make it more clear. Eye blink contains mostly low frequency contents, jaw clenching contains mostly high frequency contents, alpha wave is ~9Hz in this example, and utility pollution (noise) is 60Hz. The spectrogram shown here is using logrithmic frequency (horizontal axis) scale, the maximum (right limit) is 128Hz (and can go up to 256Hz using Sensor with 512Hz sampling rate) and minimum (left limit) is 1Hz, the vertical scale is time (from top to bottom, a new FFT line is displayed every 2 seconds, and the spectral energy (in logrithmic scale in dB) is shown with false color (raindow color: dark blue being lowest, and white/red being highest.) The Gain and Offset (in minus dB) parameters are for adjusting the spectrogram display dynamic range.
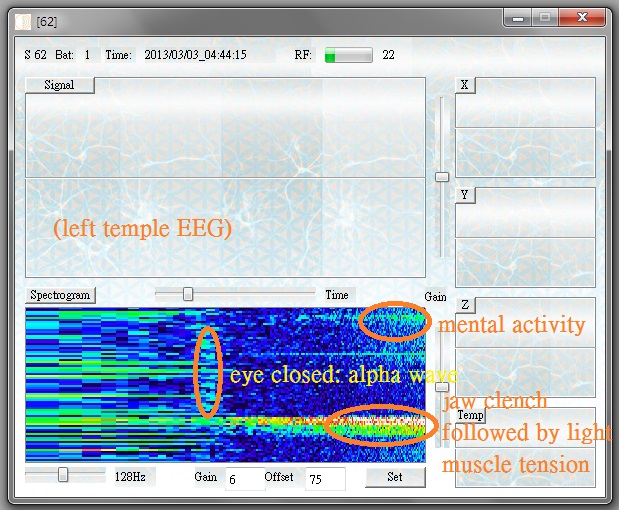
A more detailed EEG spectrogram example with mental activities (beta and gamma waves), in addition to muscle (EMG) and alpha wave (eye closed) activities. If the display max. frequency is set at 256Hz, then the EMG (with higher spectral energy at higher frequency) is more easily distinguishable from mental Gamma wave (with spectral energy peaked at 50~100Hz). If EEG signal is filtered down to 100Hz or below, tail of EMG spectral energy can no longer be distinguishable from gamma and beta waves. On the low frequency end, eye blink, roll and other movement (EOG) can easily contaminate delta, theta and even alpha waves.
5. For other Apps, please see their respective manuals.