
For Exploration Kit ONLY (Note: the Exploration kit and the ReLax kit are not compatible with each other, due to differences in sample rate and RF settings.)
Please follow Start-123 to start using the DIY Kit within minutes. This brief manual provides morde detailed descriptions on how to get started using the TrueSense DIY Kit.
The TrueSense bio-sensor DIY kit can capture various bio-signals conveniently and has capabilities compared to products like EEG, EKG monitors. However, the DIY kit is not considered a medical device and should not be used for monitoring or treating a medical condition.
Before you start, you will need to download OPIconsole program, and OPIconsole: a brief manual.
You probably have read through the product descriptions and learned about the basic functions of the kit. There are also many articles in public websites such as www.bioshare.info that may be of interest to you, regarding the basics of bio-signals and possible applications using the kit. After you are familiar with how to read EEG signal, this manual will guide you through the basic setup and configuration, and then guide you through some fun testing to locate your personalized brain wave bands. (My EEG Frequncy) (The OPI Console Spectrogram starts from 1Hz, with 0.5Hz increment for each band, and with adjustable maximum frequency, so you can find Alpha (α) wave and Sigma (σ) wave frequency peaks easily. Simply reduce the maximum display frequency to lower value, for example 16Hz, and count from bottom (1Hz) upwards to the band showing the peak in 0.5Hz increment, and write down the peak frequency value.)
1. Connecting the Pieces:
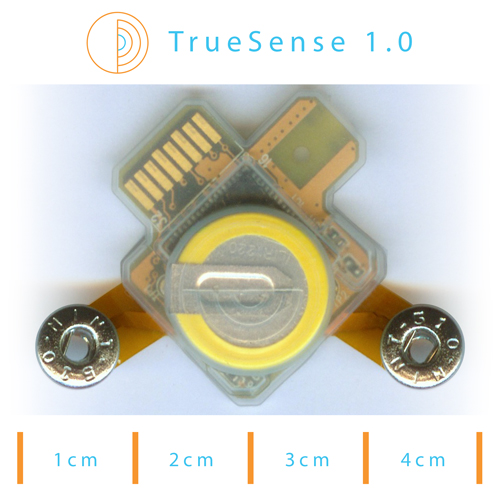
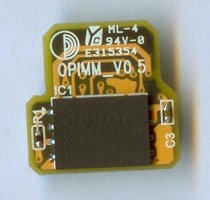
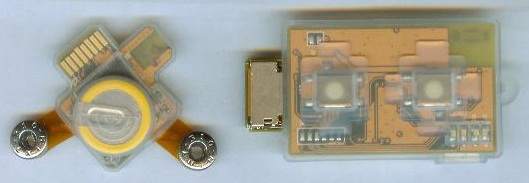
There are 3 main electronic components in the kit: the sensor, the memory module, and the controller.
1.1. Gently pull back the silicone flap protecting the gold fingers (microSD contact fingers) on the sensor and plug into the microSD socket (with metal bracket on top) of the memory module (see photo). The gold fingers on the sensor should be facing down while the gold fingers on the memory module should be facing up, if you can see both sets of gold fingers while plugging in, their relative orientation is incorrect, and you should flip one of them over, then plug them together. Don't worry, there is no harm if you insert the devices together upside down accidentally, there will be no electrical connection, and you can simply flip over one of the devices and re-plug in to correct it.
Sensor with Memory Module mounted
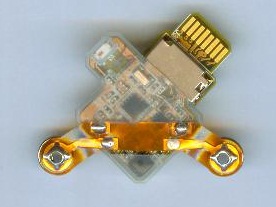
1.2. Then plug the memory+sensor combo into the controller microSD socket (with metal bracket on top), with the gold fingers (microSD contact fingers) on the memory module facing down. (see photo). Don't worry, there is no harm if you insert the devices together upside down accidentally, there will be no electrical connection, and you can simply flip over one of the devices and re-plug in to correct it.
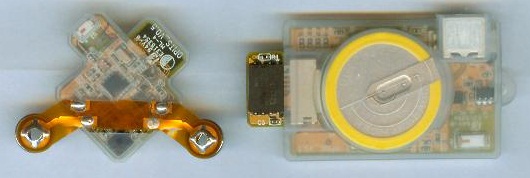
Sensor, Controller with Memory Module inserted
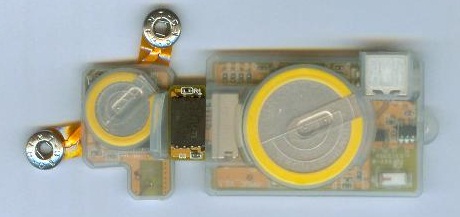
Sensor plugged into Controller with Memory Module inserted
2. USB Connection and Charging:
Now attach the supplied short USB adapter cable (note: there is no USB power supply included in the kit), with the mini-USB side plugged into the controller, and the regular (USB-A) side plugged into your PC, and start charging.
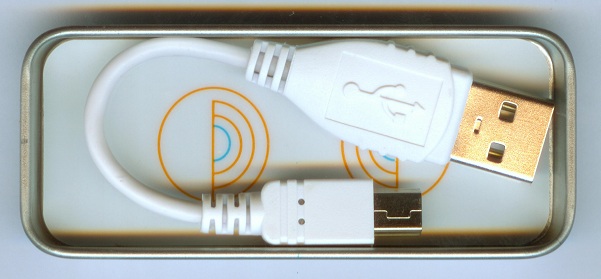
Short USB adapter inside metal carrying case.
If your PC (desktop, or notebook, or netbook) does not have regular USB slot, then you are probably using a small tablet, and you will need a special adapter (not included in the kit). Check your tablet PC accessories, it may usually come with such special adapter (such as USB female to mini-male adapter, or USB female to micro-male adapter) already. If not, you may need to purchase such adapter depending on what type of USB socket is on your tablet PC. Some online examples are shown here, but you should do your own search to find the correct adapter and the merchant you like.
http://www.amazon.com/USB-Female-Mini-Male-Adapter/dp/B0016RNX2I or http://www.amazon.com/eForCity-Micro-Female-Male-Adaptor/dp/B0023FTRUO
The short USB adapter cable should be plugged into a USB slot that's as close to you as possible, and you can adjust the controller's orientation and angle to optimize for wireless signal reception during bio-feedback experiments. The high quality bio-signal data will be stored in the memory module, and are immune from corruptions and interferences due to crowded wireless data communication spectrum.
To minimize any possible harmful effects from wireless RF radiation, the sensor's wireless transmission power level is intentionally set very low (below -4.5dbm level) and with very low duty cycle (being ON for less than 1% of the time). So the average transmission power level at the sensor (very close to human body) is typically below -35dbm level.
The kit requires a PC to operate and uses the PC's USB port to charge the kit. If you have any standard USB power supply, and/or longer USB adapter cable, you can use them to charge the kit, and for connecting to your PC.
While the kit is being charged (no special USB driver is required), you should download and install the TrueSense Manager/SDK software onto your PC. Then you can start this Application for the first time, with the kit attached.
3. Run OPIconsole program: Please follow the practice procedures described in OPIconsole: a brief manual to get familiar with the various functions and features.
After the application is started, click on "Refresh" button, the application will communicate with the controller, the sensor and the memory module, performing pairing setup and configuration automatically, and return status information and save the configuration.
3.1. Configuration APP, Manual Parameter Setting and Explanations.
Even though all parameters will be configured automatically, and you don't need to change them manually. You do have the option to edit a few parameters.
1) Zigbee channel assignment: For advanced users, if you know of fixed-channel high power WiFi (channel 1 to 14) sources that are crowding the air wave, you can set the desired wireless Zigbee channel (from 11 to 26, that roughly correspond to WiFi's 1 to 14) between the sensor and controller, to reduce possible interferences.
2) Double-Tap control for sensor: Depending on your preference, you can change how the sensor ON/OFF is controlled. When the sensor is plugged into the controller, the sensor will enter idle mode while its battery is being charged. When the sensor is removed from the controller, it will either stay in idle mode, or enter active mode, depending on this setting.
(i) Double-Tap off: this is the default setting. The sensor will enter active mode when removed from the controller.
(ii) Double-Tap on: The sensor will stay in idle mode, until a valid Double-Tap command is detected, then it will enter active mode. The sensor will toggle between active mode and idle mode, with each successive valid Double-Tap command. This is a very cool Star Trek mode, suitable for interactive applications (real-time signal viewing, game playing, bio-feedback, etc.) where you can see the effects of sensor being turned On and Off immediately. This mode is NOT recommended when you are taking long duration bio-signal data, because certain body motions may match Double-Tap signature and the sensor may be turned On or Off accidentally.
3) Memory Upload and Erase: When the memory module is plugged into the controller, and the controller is connected to your PC, you can start memory Upload to store the high-quality bio-signal data set on the PC. Upon successful completion of uploading all the memory contents of the memory module, please erase the memory module to be ready for data recording again. As it will take a few minutes to upload data and fully erase the entire memory module, please do not disturb the memory module to prevent any content corruption or mal-function of the memory module.
3.2. Sensor-Controller Pairing:
1) Single Sensor Pairing: If you have a single kit, you don't need to do any special operations.
2) Multiple Sensor Pairing: If you have multiple kits, and plan to operate them together as a single set with multiple sensors, please configure each kit separately first to ensure their proper operations. Please run through all the Get Started routines and learning applications, while using Single Sensor pairing to keep things and learning sessions simple. After all the successful learning sessions, and when you are ready to do the more advanced multiple sensor operation, please choose only one controller (all the other controllers will be spare ones now), and follow the multiple Sensor menu, to pair up each sensor sequentially with the same controller during the same session.
After this is done, then you are ready to run the sensor(s). You can rerun the OPIconsole as many times as you like, the latest run will always override previous settings. So it's very good practice to rerun the OPIconsole before you start any serious experiment and data taking. Particularly, if you or someone else had likely played with your kit(s). Even though most configuration data are stored in non-volatile memory inside the sensor, memory and controller, the synchronization time reference may have been lost or corrupted, if either one of the sensor or the controller has completely run down the battery and entered the shut-down mode. It's a good practice to rerun the OPIconsole to check their status and to ensure proper pairing and time synchronization.
The sensor and the controller can work together ONLY if they are paired up through the OPIconsole properly.
Next, let's start up the sensor kit to take some data.
4. Sensor Attachment:
4.1 Mylar patch: The kit includes a mylar silver patch and a set of silver (Ag) plated electrodes with plain mylar patch.
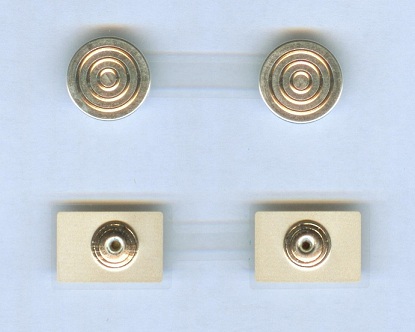
silver (Ag) plated electrodes with plain mylar patch (above, used as Dry electrode) and mylar silver patch (below, can be used with adhesive gel as Gel electrode).
To take data, you can use the bio-sensor with either dry electrode or gel electrode. Dry electrode is easier to handle and use. However, gel electrode provides more reliable skin contact resistance, reduce vibrational artifacts, and better performance than dry electrodes when high quality low frequency EEG signal bands are required, such as in sleep and mediation analyses.
4.2 Thin Silicone Strip headband + Ag-coated dry electrode: The kit includes a pre-assembled headband with Ag-coated dry electrode. You can adjust the elastic string to fit your head size. We recommend that you use the sensor with this combination to get a quick start. Simply snap on the sensor to the patch securely as a single assembly. You can now 'wear' the headband assembly over the forehead and start taking data.
The location of dry electrode pair on the headband may be changed by unclipping the mylar guide, reposition the electrodes to the desired location, and clip on the mylar guide to hold them in place. The kit also includes one bundle of elastic string (~200cm length). Please follow the instructions in How to adjust elastic string and wear silicone headband? to learn.
4.3 Adhesive gel: Please refer to How to apply Gel Pads on to Mylar Electrodes to learn how to mount re-usable conductive adhesive gel to mylar silver path. Sealed pairs of replacement conductive adhesive gel are included in the package. Within sealed package and properly stored in cool, dry, shaded area, its shelf life can be up to 1 year. The re-usable conductive gel may be reused for up to 30 times. Please rinse them lightly in clean water for cleaning and re-hydration. Keep them under the protection sheet and away from dusts, lints, or any other surfaces. Do not pull or attempt to remove from the mylar patch, unless you are ready to replace them. For light-duty short duration testing, with the subject in static posture without much movements, the adhesive gel should be sticky enough to hold the sensor in place and with good electrical contact. (Please read How to apply electrodes with good skin contact) For longer duration testing, with moderate movements, additional support is recommended.
You can use the silicone strip headband with this gel electrode set. Simply overlay the headband over the mylar silver patch (with its bottom adhesive surface protected) at the desired location with studs come through the holes. Then snap on the sensor to the patch securely as a single assembly. You can now "wear" the head band assembly over the forehead. Rub gently to ensure the gel pads are adhering well to the skin.
4.4 Preformed adhesive tape: The kit includes a set of preformed adhesive tapes. The holes on the adhesive tape will match up with the studs on the mylar patch. Please overlay the adhesive tape over the mylar patch (with its bottom adhesive surface protected) securely. After suitably cleaning and damp-dry the skin spot (using soap and water or light rubbing alcohol to remove skin grease), remove the patch assembly from the protective non-stick sheet (provided) and place on the desired skin spot for measurement. Rub gently to ensure the gel pads and adhesive tape are adhering well to the skin. After the patch is properly attached to the skin, the sensor can be snapped on and off from the patch easily. The performed adhesive tape could be very helpful in providing additional security to sensor attachment on to different body locations.
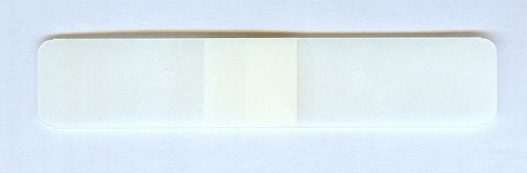
Preformed adhesive tape.
5. Practice and Learning session:
Before you attach the sensor, please make sure you have configured single sensor pairing with RF ON, Double-Tap OFF feature.
Learn about the sensor wearing locations.
For this session, it's best to wear the sensor around the temple (for the Star Trek Seven-of-Nine look), because you can capture more types of brain waves and muscle effects at this location. Choose either right side or left side based on where is the USB port the controller will be plugged into, and make them the same side, so as to ensure good wireless communication between the sensor and the controller. Adjust the orientation and angle between the controller and the sensor (your head, in this case) for clear line of sight without obstruction in between, to maximize wireless signal quality. (Note: the actual bio-signal data captured and stored into the memory module, will not be corrupted by less than perfect wireless communications. So long as the "real time" wireless data stream captured for display by the controller is mostly successful and valid, you are totally OK to run this and other interactive applications. The high quality captured data will be uploaded to PC for detailed analyses and storage after you are done with all these sessions.)
With the controller connected to PC through USB cable, wait for the PC to recognize the USB device. Start the TrueSense application, for the display function, select the sensor (there should be just one), and select both ADC and Acc-Z signals for viewing. (Note: even though you only select a few parameters for viewing, ALL of the data will be captured on memory for later upload to the PC for analyses and storage.) If everything is setup properly, you should see signals start moving on the display. If the signal is intermittent, adjust the orientation and angle of the controller (as described above.) Now let the fun start.
5.1 Accelerometer XYZ functions: (Acc-Z channel in this case.)
Tilt your head forward and backward slowly, see the Acc-Z data stream goes down and up, capturing your posture. This data is great for tracking head posture, particularly if you bend down your head too much for too long, working on the PC or tablet or smartphone. This data also tells you when you are dozing off or nodding enthusiastically, during meditation or meeting or conversation or driving.
Tilt your head sideways, left and right, slowly, see the Acc-Z data stream changes slowly, combined with the not selected Acc-X, Acc-Y, capturing your posture. This data is great for tracking head posture, particularly if you tends to tilt to one side and putting uneven strain on your spine. You can use these head posture data as inputs for video game, such as flight simulation, ski, and other sporting games.
Double-Tap practice: This is fun and cool, what everyone does in Star Trek, when they tapped (well, it really should be double-tap) their gadget and called "beam me up, Scotty." Just like mouse double-click, you do need to do a little practice to get the hang (timing and force) of it. Go ahead, tap it once, wait a bit, tap again, and see how the signal looks like, and if the Double-Tap is captured by the PC (and sensor) correctly. Once you have mastered this double-tap, you can use this command to turn On/Off your sensor, or as command input in application programs.
Walking and Running: well, these are so pedestrian, let's not do them for now.
5.2 EMG: (Signal channel)
Our muscle neurons generate very strong and high frequency signals with broad bandwidth (typically 80~3000Hz) that can spill down to below 40Hz. If the sensor has limited bandwidth (containing only signal below 64 or even 32Hz), then the muscle neuron signal (EMG) may contaminate or be misclassified as super beta wave (or gamma wave, typically 30~150Hz) or beta wave (typically 12~40Hz).
To see how strong the EMG signal is, tighten your forehead muscle and see the ADC signal grow drastically. Try different facial muscle one by one, and the results are all pretty much the same. Generally, we can not differentiate between any particular muscle groups, but we can tell if at least some of them are tightened. This is useful information for assessing how relaxed you are, that is, whether all facial muscle groups have been relaxed from tightened state.
Jaw Clenching: There is a neat trick that can be very useful later on, let's call it "jaw clenching". Keep your mouth closed, with back of upper jaw and lower jaw close together in contact, tighten your jaw muscles slightly and see the ADC signal goes big, tighten them more and see even bigger ADC signal. Now, let's try the equivalent of "double click": tighten the jaw for 1 second, relax for 1 second, and then tighten for 1 second again. See the nice double-clench signals on display. Try a few times more, until you get the hang of it.
Note that this jaw clenching is practically invisible to others. Once you have mastered this "jaw clenching" trick, you can use it as event marker to tag various activities or beginning or end of certain events. You can define for yourself various markers: single clench, double clench, three or more clenches, normal clench, slow clench, etc., all for specific purposes and for later analyses. As you review the stored data set later on, you will note the "jaw clenching" is clearly and easily distinguishable in both time domain and frequency domain from other events. The "jaw clenching" can be used as tagging marker, and a very useful and versatile one.
5.3 EOG: (Signal channel)
Electrooculography (EOG/E.O.G.) is a technique for measuring the resting potential of the retina for recording eye movements. As we wear the sensor near the eye for this test and learning session, you can easily view its effect.
Blink your eye, you will see a spike (actually the duration of your eye movement) in the EEG signal, blink rapidly and the spikes are closely spaced. Notice that there's very little EMG signal (sharp high frequency spikes) here, just smooth slow changes caused by detection of retina potential change. Slowly roll your eyes side by side, you will see a corresponding slow change in EEG signal. Slowly roll your eyes up and down produces similar results. EOG is useful in detection of eye movement, and can be useful indicator (not the only one, though) for REM (rapid eye movement) phase of sleep.
It has mostly low frequency content, directly caused by frequency of eye movement, and so by itself may be difficult to be distinguished from other low frequency signal sources, such as slow delta wave. You can easily create "resonant" EEG patterns by manipulating (so called "cheating") slow/fast periodic eye movements consciously, even with eyes closed. http://en.wikipedia.org/wiki/Electrooculography
5.4 EEG: (Signal channel)
Beyond signals caused by physical activities (EMG, EOG), the remaining true EEG (Electroencephalography is the recording of electrical activity along the scalp) signals generated by brain neuron firings are much smaller and are normally analyzed using frequency analysis (FFT or fast Fourier transformation).
Our brain contains tremendous number of neurons and synapses (estimated at about 100 billion neurons and 100 trillion synapses), so any measurable signal is the combined activities of huge number of neurons. Do not expect EEG to capture any specific "thought", or highly controllable "instruction" or "command" any time soon, really. As we (and you) have demonstrated earlier, many highly controllable and precise "EEG" signals may, in reality, be generated by minute physical movements and subtle muscle manipulations, consciously or unconsciously, that can be misclassified as brain wave signals.
True brain wave signals do tell us a lot, particularly the various synchronization states, about our level of relaxation and sleep stages, and how engaged our thought, visual and auditory systems are. Excerpt from http://en.wikipedia.org/wiki/Electroencephalography
"The electric potential generated by single neuron is far too small to be picked up by EEG or MEG. EEG activity therefore always reflects the summation of the synchronous activity of thousands or millions of neurons that have similar spatial orientation. If the cells do not have similar spatial orientation, their ions do not line up and create waves to be detected. Pyramidal neurons of the cortex are thought to produce the most EEG signal because they are well-aligned and fire together. Because voltage fields fall off with the square of distance, activity from deep sources is more difficult to detect than currents near the skull. Scalp EEG activity shows oscillations at a variety of frequencies. Several of these oscillations have characteristic frequency ranges, spatial distributions and are associated with different states of brain functioning (e.g., waking and the various sleep stages). These oscillations represent synchronized activity over a network of neurons. The neuronal networks underlying some of these oscillations are understood (e.g., the thalamocortical resonance underlying sleep spindles), while many others are not (e.g., the system that generates the posterior basic rhythm). Research that measures both EEG and neuron spiking finds the relationship between the two is complex with the power of surface EEG in only two bands (gamma and delta) relating to neuron spike activity."
To investigate the real brain waves, let's move to My EEG Frequency: customized frequency bands. (The OPI Console Spectrogram starts from 1Hz, with 0.5Hz increment for each band, and with adjustable maximum frequency, so you can find Alpha (α) wave and Sigma (σ) wave frequency peaks easily. Simply reduce the maximum display frequency to lower value, for example 16Hz, and count from bottom (1Hz) upwards to the band showing the peak in 0.5Hz increment, and write down the peak frequency value.)